Showing posts with label TTUKa Radars. Show all posts

Friday, April 3, 2015

TTUKa Radar Update: Streaks, Surges, and Tower Wake

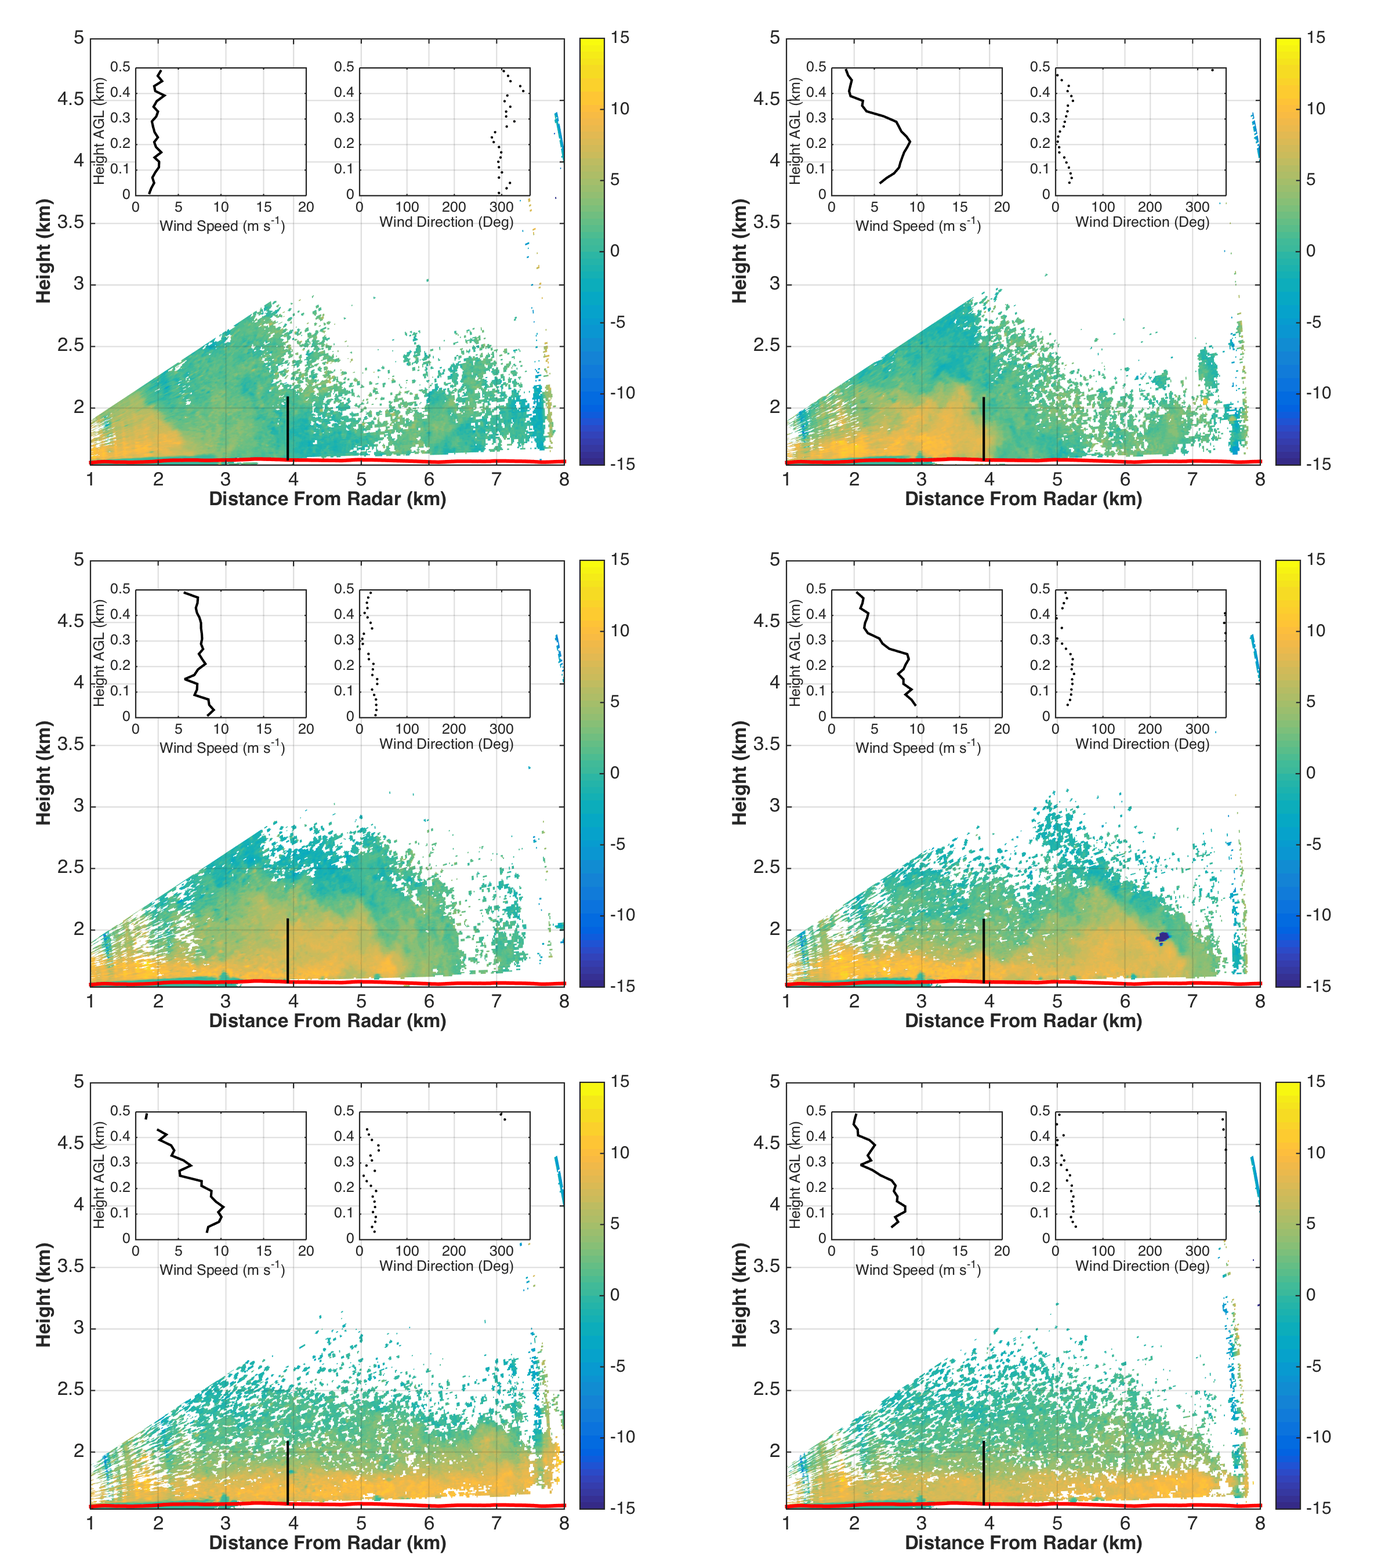
The TTUKa radar team was able to collect several hours of coordinated dual-Doppler data during the snow that fell during the afternoon / evening of 2 April 2015. From the perspective of TTUKa2 looking south west: 

Between approximately 20:20 UTC  on 2 April and 04:00 UTC on 3 April, we collected 4 hours of dual-Doppler sectors, 30 min of which was a high temporal resolution 10 degree sector at elevation angle corresponding to the 100 m supersite level. Outside of that 30 min period, the dual-Doppler sectors had a revisit time of about 22 seconds for the entire volume. We also did a dual-Doppler stare at 100 m over the supersite which ended up lasting about 1.5 hours. Finally, we included 30 min of virtual towers using the intersection point over the supersite and the fast scan speed resulting in a revisit time of approximately 3 seconds for a dual-Doppler profile. 

Within this dataset we noticed many interesting features. First, the single-Doppler radial velocity field  from TTUKa2 at the lower tilts (1.5 degrees in particular) displayed a "streaked" structure. This structure was less defined at higher tilts in the volume such that it was barely noticeable at the 3.0 degree tilt.  


In addition to the detailed structure of the wind during the more uniform flow, there were also several wind ramps that disrupted the structure. One such ramp (or surge) contained broad circulations on the leading edge that can be seen rotating over the general area of the tower. An animation of the ramp can be seen here: Wind Ramp. A very small wake from the BAO tower also was evident during several of these ramps. An example can be seen here: BAO Tower Wake . In both animations, the BAO tower is identified as the magenta "+" in the middle of the sector. The wake can be seen as slightly reduced wind speed values extending south of the tower for a short period. This wake wasn't obvious all the time and may be related to the particular wind direction of the surge in wind speed. The above links don't quite do the animations justice, so if you would like to see a somewhat higher resolution version, feel free to email me (scott.gunter@ttu.edu). 

We will continue to monitor to the clear air data quality before concluding our participation in the data collection portion of XPIA on 7 April. I will hopefully return to daily blog posts (more frequent if conditions warrant) until then.

Tuesday, March 31, 2015

Clear Air Vortices as seen by the TTUKa Radars

Yesterday (30 March 2015), provided an opportunity to collect a couple hours of clear air dual-Doppler sectors over the BAO field site. These coordinated scans occurred from 20:16 - 21:16 UTC and 22:09 - 23:09 UTC. The data quality were generally good, however pockets of noise will have to be removed before dual-Doppler analysis during some time periods. While the focus will be the dual-Doppler wind synthesis over the dual-Doppler domain, TTUKa1 captured several unique features (unfortunately just outside the dual-Doppler domain) early in the afternoon.

As seen from the radial velocity field, multiple small vortices drifted to south - southwest for a time, possibly associated with a boundary of some sort. The vortices are seen below as couplets of inbound (blue) and outbound (red) radial velocities. For clarity, five vortices have been circled in the static image below:


It is interesting to note that four of vortices are cyclonic and one is anticyclonic. An animation (over the course of ~ 15 minutes) of the above radial velocity field shows the vortices movement as well as their expansion and decay. The largest in size had a delta-v across the circulation of about 14 m/s.  The BAO tower is identified as the magenta "+" near the top of the domain.


The vortices were also evident in the reflectivity field, with the largest even displaying a weak echo region at the center (typically seen in larger vortices, such as dust devils and tornadoes):


Special thanks to Rich Krupar for helping with the animations and data conversions.


Monday, March 30, 2015

TTUKa Dual-Doppler Sectors

As discussed on the conference call this morning, we have switched our focus to dual-Doppler sectors.  The coordinates of the radars (for today) are as follows:


TTUKa1
TTUKa2
Latitude
40.06212
40.08043
Longitude
-105.03716
-104.98412

We are currently running 30 degree sectors. The approximate north-relative azimuths for our sectors are 110 - 140 degrees for TTUKa1 and 193 - 215 degrees for TTUKa2. Factoring in the blanking region of TTUKa2, the dual-Doppler domain looks (roughly) like this:


The dual-Doppler domain is roughly 2 km W-E by 3 km N-S. This could change slightly (especially in the southern part of the domain) based on the choice of crossing angle and the slight differences in coordinates of each radar for a given deployment. 

To cover the layer from 80 - 120 m (AGL) over most of the domain, we are running 6 elevation tilts over the sectors. Due to a large elevation change over the domain, the 80 m level may not be resolved in the far SE corner. This level should be resolved over the supersite though.  Based on the data quality, we are operating in two modes: a slow scan mode where the entire volume is sampled in approximately 50 seconds (for marginal data quality) and a fast scan mode where the entire volume is sample in approximately 24 seconds (for awesome data quality). The elevation angle sequence for each radar is as follows: 

TTUKa1 Elevation Angles
TTUKa2 Elevation Angles
1.7°
1.5°
2.0°
1.8°
2.3°
2.1°
2.6°
2.4°
2.9°
2.7°
3.2°
3.0°

We have collected 2 hours of dual-Doppler sectors so far this afternoon using the slow scan mode. Data collection is on going (as of 23:20 UTC), but coordinated scanning has been paused to evaluate data quality. I will try to provide another update later this evening once we have confidently finished data collection. 

Friday, March 27, 2015

TTUKa Radar Update

We had fairly decent clear air signal today and were able to collect approximately 4.25 hours of dual-Doppler data. We began scanning at 18:20 UTC and acquired 30 minutes of virtual towers (at the RHI intersection offset from the lidar supersite) using a faster scan speed to increase temporal resolution. The scan speed was then reduced to allow for better data quality. We collected 3 hours of virtual tower data with the slower scan speed. With the reduced scan speed, data quality were very good. Only a few time periods contained noise at the dual-Doppler intersection point. Dual-Doppler sectors over the BAO site comprised the last 30 minutes of the deployment, but second trip echoes and degrading data quality will probably limit the usefulness of some of that time period.

We expect conditions to be similar tomorrow, and will target another clear air deployment. Todays scanning brings the total number of minutes scanned to 5501 of the available 7200.

Thursday, March 26, 2015

TTUKa Radar Update

The noon test scan revealed little in the way of coherent velocity data and a lot of second trip echoes. An additional test scan around 5:30 pm produced even more second trip and fewer coherent velocity data. Thus, no coordinated radar scanning will be done today. 

We will look forward to tomorrow as well as the weekend when temperatures (and hopefully convective mixing) will increase, and we can get more scatterers in the air. 

TTUKa Radar Update

Several hours of coordinated data were collected this on the morning of 25 March 2015. TTUKa radar teams were deployed and scanning before 13 UTC to take full advantage of the precipitation. The precip began as rain and remained liquid for the first 45 minutes or so of data collection. During this time period, the radars were preforming virtual towers over the lidar supersite. The higher reflectivity allowed this with few clutter / side lobe issues. Precipitation quick transition to moderate snow around 14:20 UTC.  Wind speeds approaching 20 m /s were noted near the top of the RHI as well as in the BAO tower data. It will be interesting to note differences in dual-Doppler and lidar / tower wind speeds associated with different scatterers.

The homogenous nature of the reflectivity during the precip also allowed for collection of dual-Doppler sectors over the BAO site. In addition to the horizontal variability of the wind field, this scanning strategy will should also allow for the computation of vertical velocity. Sectors were preformed from 15:19 UTC through 16:27 UTC. Near the beginning of this segment, streaks were noted in the low level wind field. The "streaky" nature to the wind field gradual diminished through the collection of the dual-Doppler volumes. As seen from the perspective of TTUKa2:


We collected data until the precipitation ended, adding 383 minutes to being the total to 4987 minutes out of the available 7200.

Data from previous deployments continue to be minimally processed. The 23 March 2015 clear air data display many interesting features, including gusts and lulls: 


In the above animation, the radial velocity (m/s) from TTUKa2 is shaded. the dual-Doppler wind speed and direction profiles from the intersection point (vertical black line) are inset at the top left and right respectively. The mean wind speed and direction profiles for the entire time period (about 20 minutes) are also included as the dashed (dotted) gray profiles in the wind speed (direction) inset.

While clear air data quality were excellent for a while, we experienced an abrupt drop in coherent velocity data. This decrease is thought to be related to some virga-induced outflow that may have scoured the atmosphere:

We will continue to peruse the recently collected data for interesting features. 


Tuesday, March 24, 2015

TTUKa Radar Update

The TTUKa radars observed really good clear air data quality yesterday (23 March 2015). As such, approximately 5.4 hours of dual-Doppler scanning was done. Outside of surveillance test scans, the coordination was in the form of virtual towers at the intersection location. When the data quality was exceptional, we increased the scan speed for better temporal resolution. Alternatively, we slowed the scan speed when data quality were less than exceptional. One of the radar operators also noticed that a smoke plume in the region may have contributed to a sharp increase in data quality / coherency toward the end of data collection. More details to come as we are still processing everything.

Today's efforts (24 March 2015) were considerably less successful. We attempted to sync with ongoing triple Doppler virtual towers at the supersite and radar intersection point, but the data quality were on the low end of marginal. Nonetheless, we collected virtual towers through multiple radar intersection / supersite lidar triple - Doppler blocks between 18:33 and 19:00 UTC. This should several profiles during this time period for comparison. After 19:00 UTC, it was determined that data quality were too poor to warrant further coordinated scanning. We performed another short test scan around 23:00 UTC, but there were still little to no coherent velocity data.

The chance for light precipitation definitely has our attention for tomorrow (25 March 2015). Hopefully there will be enough to suppress second trip echoes and still provide for lidar / radar comparisons.

We have currently used 4604 minutes of the available 7200 minutes.

Saturday, March 21, 2015

TTUKa Radar Update

Data quality was much improved today compared to the last several days. RHIs revealed large vertical towers of coherent velocities over 1 km in depth suggesting a well mixed boundary layer:
TTUKa2 RHI from 21:08:45 UTC. dBz on the left; Radial velocity on the right 
Given the data quality, we decided to attempt an hour long coordinated stare with HRDL. The stare occurred between 22:30 and 23:00 UTC. However, a sampling issue with staring software of TTUKa2 caused the stare to extend 20 minutes past the end of the designated stare with HRDL. Ray data during this period suggested intermittent periods of noise and coherent velocities. An RHI was also performed after the stare and revealed much less in the way of good velocity data:

TTUKa2 RHI from 22:55:43; dBZ on the left and radial velocity on the right. 
Today's test scan combined with the afternoon coordination with HRDL brings the total number of minutes scanned to 3763 out of the available 7200. We expect tomorrow to be similar and will look to coordinated with the ongoing dual-Doppler stares over the supersite.

Friday, March 20, 2015

TTUKa Radar Update

Several brief test scans throughout the morning and afternoon revealed an atmosphere unsupportive for coordinated data collection. However a significant improvement in the coherent returns ( as compared to yesterday's test scan) was noted.

Tomorrow's plan is much the same. If conditions are favorable, we will look to coordinated with HRDL and / or the current ongoing dual-Doppler stares over the tower and supersite.

Thursday, March 19, 2015

TTUKa radar update and some data analysis

Test scans this morning revealed not enough scatterers and an overabundance of second trip echoes to warrant coordinated scanning today (19 March 2015).

However, we were fairly active yesterday. First, we believe we have the generator issue with Ka1 resolved (for real this time...). The culprit seems to have been a clogged fuel line. While one team was tending to the generator, TTUKa2 was able to coordinated stares (5 min in duration) with HRDL in clear air. Though the returns were marginal from the Ka perspective, several of the 5 minute periods will likely provide good comparisons. We terminated coordination with HRDL just before 0 Z 19 March due to deteriorating data quality. We redeployed at approximately 04Z 19 March to collect virtual towers in the light precipitation. 36 minutes of virtual towers were collected before the small area of precipitation moved out of the area and degraded data quality. Given the precipitation, this iteration of coordinated RHIs placed the virtual tower directly over the lidar supersite (instead of the 102 m SE offset). Hopefully the precip was light enough to enable some lidar profile data collection for comparison. We also attempted to perform dual-Doppler sectors to compliment the dual-Doppler lidar stares that were ongoing. However, second trip echoes brought a quick end to the deployment about 10 min into the dual-Doppler sector scanning. 

The combined efforts of yesterday and today being the total number of minutes scanned to 3625 of the available 7200. We will look for more opportunities to coordinate with other platforms in the future. 

Preliminary analysis of previously collected datasets is ongoing (albeit slowly). The 16 March 2015 is proving to be very interesting. Several different clear air environments were sampled thanks to the passage of several boundaries. One such boundary that transversed the area around 17:55 Z resembled a density current from the perspective of TTUKa2. The dual-Doppler wind profiles behind this boundary occasionally demonstrate a low-level jet type structure after the passage of the leading edge of the boundary: 


The RHI of Ka2 was mostly aligned with the wind behind the boundary. TTUKa1, with an RHI azimuth of 117.7, sampled the component parallel to the boundary. While this was generally unexciting, there did appear to be a vertical circulation (misocyclone?) along the frontal boundary. This appears in the RHI as a column of outbound radial velocities gradually replaced by a column of inbound radial velocities near the surface at approximately 2. 9 km range. This is purely speculative at this point, but the signature is interesting nonetheless. 


Monday, March 16, 2015

TTUKa Radar Update

TTUKa radar teams have been in the field most of the day. TTUKa2 has been collecting data almost continuously, but TTUKa1 has been struggling with generator issues. After significant troubleshooting, we have managed to collect several hours of coordinated RHIs that coincidentally (and very luckily) included the passage of the first boundary just after 18 Z and the passage of the primary front / wind shift around 22 Z. We are back up and collecting coordinated RHIs again (as of 23:40), and seeing higher wind speeds (as also demonstrated by HRDL and the BAO tower). We will continue scanning as long as data quality is good. I will update more thoroughly later this evening. Not sure if the generator issue is completely resolved, so we will hold on coordinating with other teams at the moment.

Sunday, March 15, 2015

TTUKa radar update

Yesterday and today have both been excellent for clear air data collection. On 14 March, the TTUKa radar team began coordinated scanning around 20:17 UTC. We did coordinated RHIs from 0-10 degree in elevation such that the intersection point was about 100 m (200 m) southeast of the lidar supersite (BAO tower). We collected approximately 45 minutes of virtual tower data. At 21:11:00 UTC we implemented a dual-Doppler stare at 150 m AGL over the intersection point defined by the virtual towers. We did this to mimic the concurrent 150 m stare by HRDL over the lidar supersite from 21:00 through 22:00 UTC. We collected ray data at 2 Hz and terminated the stare at ~22:17 UTC.  We then did 20 degree dual-Doppler volumes (8 tilts corresponding to the 6 tower levels plus 350 and 400 m ) for approximately an hour. The revisit time for each volume was ~ 9 seconds.  Finally, we collected another hour of coordinated RHIs from 23:38 to 00:38 UTC.

The coherency was decent through the majority of data collection, but there were still pockets of noise. Also, wind speeds were painfully light...according to the tower, the wind speeds were below 4 m/s for the majority of the time period. Nonetheless, a good clear dataset has been collected.

We scanned 569 minutes yesterday bringing the project total to 1893 / 7200 minutes.

We are still in the field taking measurements (as of 00:45 16 March UTC).  Data preliminarily have been of better quality today. Also, the wind speeds were higher (within the 4 - 8 m/s range). We didn't do any stares today, but focused on virtual towers and dual-Doppler volumes instead. More updates to come.

Anticipating similar conditions tomorrow, we plan to get out to the field early to attempt to observe the transition from the morning to afternoon boundary layer. We are also expecting precipitation Wednesday and Thursday. We'll see how that evolves.

Friday, March 13, 2015

TTUKa radar update: Fronts, Virga, and outflow

The TTUKa radar team was able to collect coordinated dual-Doppler measurements over the BAO site yesterday evening. We targeted a weak cold front and subsequent light precipitation / virga that passed through the area just after 00 UTC on the 13th.  There was just enough convergence of Ka scatterers to observe the near-surface structure of the frontal boundary (TTUKa2 reflectivity on the left and radial velocity on the right):


A few wind profiles of the frontal passage from virtual tower scanning may also be available (analysis pending). Persistent second trip echoes contaminated much of the pre- and post- environment until some light precip began falling behind the front. Virga was also observed and likely contributed to the higher wind speeds observed in the TTUKa radial velocity fields and dual-Doppler wind profiles. Below is an animation of 15 minutes of good radial velocity data (m/s) from the perspective of Ka2:

The location of the RHI intersection location is denoted by the vertical black line. The solid red line is the 30 m NED elevation.  These data have only been edited slightly, thus second trip echoes are still visible in some places. The wind profile (revist time of ~ 8.9 seconds on average) demonstrates substantial evolution through the time period, including several jet profiles that are reminiscent of outflow. The latter is not surprising given observed virga.  Based on a quick peak at the tower data from the BAO website, there was decent agreement between the tower wind speeds and the dual-Doppler speeds.  Interaction of the outflow winds with terrain features was also observed and perhaps some terrain speed up effects as well.

It should also be noted that only very light precip was noted at both the location of TTUKa1 and TTUKa2, so hopefully data from the lidars (and other instruments) will be able to be compared to the radar data. Also, the dual-Doppler intersection point was ~105 m from the lidar supersite and ~206 m to the southeast of the BAO tower. I do want to emphasize that these data are very preliminary and reflect only slight editing / quality control.

In all we collected approximately 2.5 hours of coordinated data yesterday evening.


The air mass in the wake of last night’s activity was not conducive to coordinated data collection despite performing multiple test scans to make sure. While data quality was not terrible, the low cu field did create second trip echo issues that could not be overcome in the low reflectivity environment. We used 39 minutes for test scans today which, combined with the data collection efforts yesterday brings us to 1324 minutes of 7200 total minutes.