Tuesday, March 31, 2015

Clear Air Vortices as seen by the TTUKa Radars

Yesterday (30 March 2015), provided an opportunity to collect a couple hours of clear air dual-Doppler sectors over the BAO field site. These coordinated scans occurred from 20:16 - 21:16 UTC and 22:09 - 23:09 UTC. The data quality were generally good, however pockets of noise will have to be removed before dual-Doppler analysis during some time periods. While the focus will be the dual-Doppler wind synthesis over the dual-Doppler domain, TTUKa1 captured several unique features (unfortunately just outside the dual-Doppler domain) early in the afternoon.

As seen from the radial velocity field, multiple small vortices drifted to south - southwest for a time, possibly associated with a boundary of some sort. The vortices are seen below as couplets of inbound (blue) and outbound (red) radial velocities. For clarity, five vortices have been circled in the static image below:


It is interesting to note that four of vortices are cyclonic and one is anticyclonic. An animation (over the course of ~ 15 minutes) of the above radial velocity field shows the vortices movement as well as their expansion and decay. The largest in size had a delta-v across the circulation of about 14 m/s.  The BAO tower is identified as the magenta "+" near the top of the domain.


The vortices were also evident in the reflectivity field, with the largest even displaying a weak echo region at the center (typically seen in larger vortices, such as dust devils and tornadoes):


Special thanks to Rich Krupar for helping with the animations and data conversions.


Monday, March 30, 2015

TTUKa Dual-Doppler Sectors

As discussed on the conference call this morning, we have switched our focus to dual-Doppler sectors.  The coordinates of the radars (for today) are as follows:


TTUKa1
TTUKa2
Latitude
40.06212
40.08043
Longitude
-105.03716
-104.98412

We are currently running 30 degree sectors. The approximate north-relative azimuths for our sectors are 110 - 140 degrees for TTUKa1 and 193 - 215 degrees for TTUKa2. Factoring in the blanking region of TTUKa2, the dual-Doppler domain looks (roughly) like this:


The dual-Doppler domain is roughly 2 km W-E by 3 km N-S. This could change slightly (especially in the southern part of the domain) based on the choice of crossing angle and the slight differences in coordinates of each radar for a given deployment. 

To cover the layer from 80 - 120 m (AGL) over most of the domain, we are running 6 elevation tilts over the sectors. Due to a large elevation change over the domain, the 80 m level may not be resolved in the far SE corner. This level should be resolved over the supersite though.  Based on the data quality, we are operating in two modes: a slow scan mode where the entire volume is sampled in approximately 50 seconds (for marginal data quality) and a fast scan mode where the entire volume is sample in approximately 24 seconds (for awesome data quality). The elevation angle sequence for each radar is as follows: 

TTUKa1 Elevation Angles
TTUKa2 Elevation Angles
1.7°
1.5°
2.0°
1.8°
2.3°
2.1°
2.6°
2.4°
2.9°
2.7°
3.2°
3.0°

We have collected 2 hours of dual-Doppler sectors so far this afternoon using the slow scan mode. Data collection is on going (as of 23:20 UTC), but coordinated scanning has been paused to evaluate data quality. I will try to provide another update later this evening once we have confidently finished data collection. 

BAO 2015-03-30
All tower instruments functioning normally.
BAO 200m North
On 3/27/2015 ~1955 - 2005 UTC the North 200m sonic was disconnected while we repaired a boom support arm.

Friday, March 27, 2015

TTUKa Radar Update

We had fairly decent clear air signal today and were able to collect approximately 4.25 hours of dual-Doppler data. We began scanning at 18:20 UTC and acquired 30 minutes of virtual towers (at the RHI intersection offset from the lidar supersite) using a faster scan speed to increase temporal resolution. The scan speed was then reduced to allow for better data quality. We collected 3 hours of virtual tower data with the slower scan speed. With the reduced scan speed, data quality were very good. Only a few time periods contained noise at the dual-Doppler intersection point. Dual-Doppler sectors over the BAO site comprised the last 30 minutes of the deployment, but second trip echoes and degrading data quality will probably limit the usefulness of some of that time period.

We expect conditions to be similar tomorrow, and will target another clear air deployment. Todays scanning brings the total number of minutes scanned to 5501 of the available 7200.

Thursday, March 26, 2015

TTUKa Radar Update

The noon test scan revealed little in the way of coherent velocity data and a lot of second trip echoes. An additional test scan around 5:30 pm produced even more second trip and fewer coherent velocity data. Thus, no coordinated radar scanning will be done today. 

We will look forward to tomorrow as well as the weekend when temperatures (and hopefully convective mixing) will increase, and we can get more scatterers in the air. 

Issues with surface data

Yesterday morning, the data connection to our two surface stations died.  The stations are up. "bao" is archiving data locally, however the local disk on "ehs" appears to have died as well, so we are losing data from it.

In trying to fix this problem, a command on "flux" failed so that we have lost the network connection to it as well and thus cannot view its status or data.  We physically visited flux and verified that it was archiving data from the tower, but even rebooting failed to restore the network connection.

In summary:
- tower data probably are being archived
- bao surface station data are being archived
- ehs surface station data are not being archived
- real-time monitoring of everything is not working

I'll try to fix this, but I don't know what action to take at this point and both "experts" are out of town...

4pm update:
After tracking down several server issues and replacing a USB stick, all data are now coming in.  I'm pretty sure that some data were lost during the past 2 days -- I'll try to generate an inventory after the 00Z updates happen tonight.

11pm update:
After all this, the tower and bao surface data have been recovered.  We lost as much as 2 days of ehs complete high-rate data, though perhaps half of that will be filled in.  The data resynchronization and associated plots are still in process, and hopefully will be done by midnight.

9am (3/27) update:
All data and plots are now up to date.  There is a gap of about 28 hours in ehs.

UTD 200S: Revealing the Atmospheric Boundary Layer

Since April 21 the UTD 200S LiDAR is performing simultaneous triple lidar measurements, in coordination with the other two scanning lidars, Dalek 1 and 2. A preliminary data analysis shows a rich scenario for the characterization of the thermal stability of the atmospheric boundary layer, including Low Level Jets, Wind Shear, and Convective Cells. (Full credits to Mithu and Armita!)

Low Level Jet
Fig. 1: Occurrence of  Low Level Jet during night-time. Wind radial velocity.

 
Fig. 2: Profiles of the radial velocity during a Low Level Jet occurrence.

Wind Shear
Fig. 3: Wind radial velocity during the occurrence of wind shear.


 Fig. 4: Profiles of the radial velocity during the occurrence of wind shear. 

Convective Atmospheric Boundary Layer

Fig. 5: LiDAR measurements of convective cells.

  Fig. 6: Profiles of the radial velocity for a convective atmospheric boundary layer.

TTUKa Radar Update

Several hours of coordinated data were collected this on the morning of 25 March 2015. TTUKa radar teams were deployed and scanning before 13 UTC to take full advantage of the precipitation. The precip began as rain and remained liquid for the first 45 minutes or so of data collection. During this time period, the radars were preforming virtual towers over the lidar supersite. The higher reflectivity allowed this with few clutter / side lobe issues. Precipitation quick transition to moderate snow around 14:20 UTC.  Wind speeds approaching 20 m /s were noted near the top of the RHI as well as in the BAO tower data. It will be interesting to note differences in dual-Doppler and lidar / tower wind speeds associated with different scatterers.

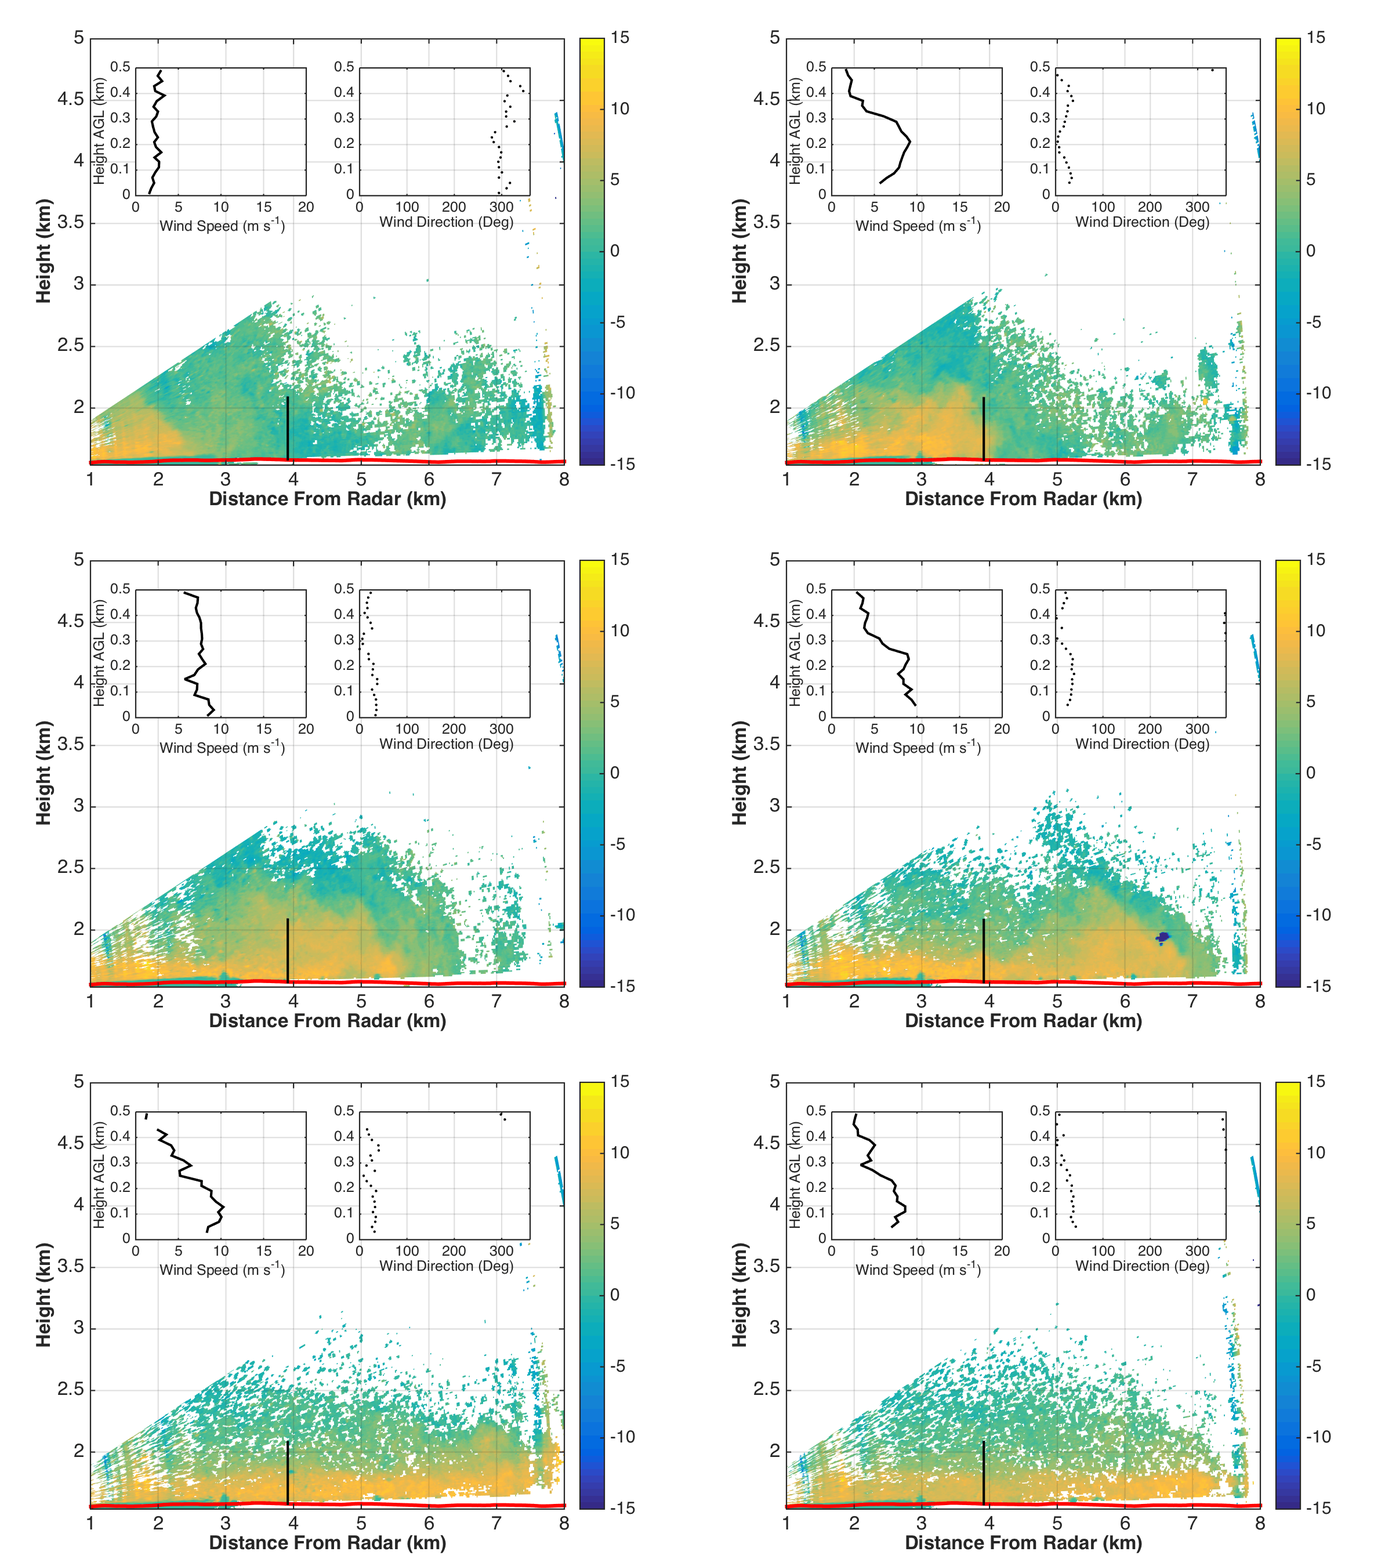
The homogenous nature of the reflectivity during the precip also allowed for collection of dual-Doppler sectors over the BAO site. In addition to the horizontal variability of the wind field, this scanning strategy will should also allow for the computation of vertical velocity. Sectors were preformed from 15:19 UTC through 16:27 UTC. Near the beginning of this segment, streaks were noted in the low level wind field. The "streaky" nature to the wind field gradual diminished through the collection of the dual-Doppler volumes. As seen from the perspective of TTUKa2:


We collected data until the precipitation ended, adding 383 minutes to being the total to 4987 minutes out of the available 7200.

Data from previous deployments continue to be minimally processed. The 23 March 2015 clear air data display many interesting features, including gusts and lulls: 


In the above animation, the radial velocity (m/s) from TTUKa2 is shaded. the dual-Doppler wind speed and direction profiles from the intersection point (vertical black line) are inset at the top left and right respectively. The mean wind speed and direction profiles for the entire time period (about 20 minutes) are also included as the dashed (dotted) gray profiles in the wind speed (direction) inset.

While clear air data quality were excellent for a while, we experienced an abrupt drop in coherent velocity data. This decrease is thought to be related to some virga-induced outflow that may have scoured the atmosphere:

We will continue to peruse the recently collected data for interesting features. 


Tuesday, March 24, 2015

TTUKa Radar Update

The TTUKa radars observed really good clear air data quality yesterday (23 March 2015). As such, approximately 5.4 hours of dual-Doppler scanning was done. Outside of surveillance test scans, the coordination was in the form of virtual towers at the intersection location. When the data quality was exceptional, we increased the scan speed for better temporal resolution. Alternatively, we slowed the scan speed when data quality were less than exceptional. One of the radar operators also noticed that a smoke plume in the region may have contributed to a sharp increase in data quality / coherency toward the end of data collection. More details to come as we are still processing everything.

Today's efforts (24 March 2015) were considerably less successful. We attempted to sync with ongoing triple Doppler virtual towers at the supersite and radar intersection point, but the data quality were on the low end of marginal. Nonetheless, we collected virtual towers through multiple radar intersection / supersite lidar triple - Doppler blocks between 18:33 and 19:00 UTC. This should several profiles during this time period for comparison. After 19:00 UTC, it was determined that data quality were too poor to warrant further coordinated scanning. We performed another short test scan around 23:00 UTC, but there were still little to no coherent velocity data.

The chance for light precipitation definitely has our attention for tomorrow (25 March 2015). Hopefully there will be enough to suppress second trip echoes and still provide for lidar / radar comparisons.

We have currently used 4604 minutes of the available 7200 minutes.

Monday, March 23, 2015


March 23, 2015 BAO Tower update and tower structure information:

All tower instruments running this morning.
There was a glitch in direction display on NCAR's website starting late last week. Fixed by Steve Oncley.

BAO Tower measurements and structural information.
 Because of the age of the tower (built in ~1976) all we have are blue prints. Below is general information and a link to some pictures.

The tower is a triangular structure 3.05m (10') wide from center leg to center leg.
The orientation of the 3 tower faces are:
334-154 degrees T
274-94 degrees T
214-34 degrees T


The booms point 334 and 154 T (within ~3-5 degrees accuracy)
The distance from outer edge of tower leg to center of sonic path is 4.3m
At each boom level there are instrumentation boxes, power boxes, and elevator control panels that increase the wind blockage. 

Tower legs are 9 1/2" dia at the bottom tapering to 4" at the top.
The lowest 40' above the ground has angle iron cross members. Above this point the cross members are rods.

The west face of the tower has two racks that the elevators ride up/dn on. It is a cog system. The west face also has our cable conduits and hoses for drawing air at 3 levels (22, 100, 300m). This face is parallel to the booms (154/324T) pointing.

The top boom is within a few feet of the very top, so there is almost no structure above it. The top of the tower has more cross members than below and has angle iron cross members again.

There are 6 guy wire connection points on each leg (18 total):
164', 328', 492', 656', 820', and 984'.  Guys are 1 7/16" dia to 2 3/16" dia
At the NE point of the triangular structure there is a ladder running from the bottom to top for emergency evacuation.


Here is where you can see some pictures of the tower:
http://www.esrl.noaa.gov/psd/technology/bao/galler

Sunday, March 22, 2015

BAO sonic data 2015-03-22
Not sure why sonic directions are not plotting on the NCAR website, but since there are sonic speeds we are getting data.

The BAO tower seen from the UTD 200S


Fig.1: Carrier-to-Noise Ratio (CNR) for the measurements performed to detect the locations of the sonic anemometers over the BAO met-tower.
In Fig. 1 the CNR of the tests carried out for the detection of the sonic anemometers over the BAO met-tower is reported. It is evident that, due to the small size of the sonics and booms compared to the height of the tower, it was not an easy task. Therefore, full credits to Armita, Mithu and Aditya, who performed those measurements!
We performed several tests in order to characterize the repeatability of the experiments, and an accuracy of 0.01 deg is observed by performing scans in the same direction and starting from a reference location, in order to minimize backlash. However, a general precision of 0.05 deg is found for general scans. 
In Fig. 2, the CNR for the boom at 50 m height is reported, which allows to perceive even the geometry of the sonic anemometers!
Fig. 2: CNR of the tests carried out in proximity of the boom at 50 m height.

Fig. 3: Sonic anemometer CSAT3 by Campbell Scientific.

Saturday, March 21, 2015

TTUKa Radar Update

Data quality was much improved today compared to the last several days. RHIs revealed large vertical towers of coherent velocities over 1 km in depth suggesting a well mixed boundary layer:
TTUKa2 RHI from 21:08:45 UTC. dBz on the left; Radial velocity on the right 
Given the data quality, we decided to attempt an hour long coordinated stare with HRDL. The stare occurred between 22:30 and 23:00 UTC. However, a sampling issue with staring software of TTUKa2 caused the stare to extend 20 minutes past the end of the designated stare with HRDL. Ray data during this period suggested intermittent periods of noise and coherent velocities. An RHI was also performed after the stare and revealed much less in the way of good velocity data:

TTUKa2 RHI from 22:55:43; dBZ on the left and radial velocity on the right. 
Today's test scan combined with the afternoon coordination with HRDL brings the total number of minutes scanned to 3763 out of the available 7200. We expect tomorrow to be similar and will look to coordinated with the ongoing dual-Doppler stares over the supersite.

UTD 200 S: third week

During the last week the UTD team was mainly involved in the calibration of the system and in detection of the sonic anemometer locations over the met-tower. During those operations, the lidar GUI experienced several events of slowing down and freezing. Interacting with Leosphere, a bug was detected in the GUI. Indeed, for each test the lidar uploaded not only the requested scans, but all the scans saved in the hard drive (more than 700!!!), thus creating overload for the RAM and in turns the GUI crash. A fix to this bug is not developed yet, thus the only temporary solution consisted in doing a back up of all the data, then erasing the HD. After this operation, the GUI still freezes sometimes, and in several cases a manual reboot is needed (Thanks Aditya for your help!).

Since last night the UTD 200S is performing 14.5 minute fixed measurements  over the sonic anemometers on the SE booms, elevations 50 m, 100 m, and 150 m. A fixed measurement is also performed over the lidar supersite, elevation 60 m. The measurements are performed with a spatial resolution of 50 m and accumulation time of 500 ms. In the following the schedule running hourly and simultaneously on the UTD 200S, Dalek 1 and 2:
  • h:00 SE sonic 50 m height;
  • h:15 SE sonic 100 m height;
  • h:30 SE sonic 150 m height;
  • h:45 lidar supersite 60 m height.


Friday, March 20, 2015

TTUKa Radar Update

Several brief test scans throughout the morning and afternoon revealed an atmosphere unsupportive for coordinated data collection. However a significant improvement in the coherent returns ( as compared to yesterday's test scan) was noted.

Tomorrow's plan is much the same. If conditions are favorable, we will look to coordinated with HRDL and / or the current ongoing dual-Doppler stares over the tower and supersite.
FYI, WWW-plots of the in-situ tower and surface data are now at:
www.eol.ucar.edu/isf/projects/CABL/isfs/qcdata/
Click on "plots" for any day.  These plots are updated hourly.  Note that if you revisit the same plot, some browsers may require that you reload to see an update.  The "QC table" link isn't (yet) active.

Suggestions for other plots to add are welcome!

Real-time plots of variables on demand also is still available at:
http://datavis.eol.ucar.edu/ncharts/projects/CABL/geo_notiltcor

Thursday, March 19, 2015

TTUKa radar update and some data analysis

Test scans this morning revealed not enough scatterers and an overabundance of second trip echoes to warrant coordinated scanning today (19 March 2015).

However, we were fairly active yesterday. First, we believe we have the generator issue with Ka1 resolved (for real this time...). The culprit seems to have been a clogged fuel line. While one team was tending to the generator, TTUKa2 was able to coordinated stares (5 min in duration) with HRDL in clear air. Though the returns were marginal from the Ka perspective, several of the 5 minute periods will likely provide good comparisons. We terminated coordination with HRDL just before 0 Z 19 March due to deteriorating data quality. We redeployed at approximately 04Z 19 March to collect virtual towers in the light precipitation. 36 minutes of virtual towers were collected before the small area of precipitation moved out of the area and degraded data quality. Given the precipitation, this iteration of coordinated RHIs placed the virtual tower directly over the lidar supersite (instead of the 102 m SE offset). Hopefully the precip was light enough to enable some lidar profile data collection for comparison. We also attempted to perform dual-Doppler sectors to compliment the dual-Doppler lidar stares that were ongoing. However, second trip echoes brought a quick end to the deployment about 10 min into the dual-Doppler sector scanning. 

The combined efforts of yesterday and today being the total number of minutes scanned to 3625 of the available 7200. We will look for more opportunities to coordinate with other platforms in the future. 

Preliminary analysis of previously collected datasets is ongoing (albeit slowly). The 16 March 2015 is proving to be very interesting. Several different clear air environments were sampled thanks to the passage of several boundaries. One such boundary that transversed the area around 17:55 Z resembled a density current from the perspective of TTUKa2. The dual-Doppler wind profiles behind this boundary occasionally demonstrate a low-level jet type structure after the passage of the leading edge of the boundary: 


The RHI of Ka2 was mostly aligned with the wind behind the boundary. TTUKa1, with an RHI azimuth of 117.7, sampled the component parallel to the boundary. While this was generally unexciting, there did appear to be a vertical circulation (misocyclone?) along the frontal boundary. This appears in the RHI as a column of outbound radial velocities gradually replaced by a column of inbound radial velocities near the surface at approximately 2. 9 km range. This is purely speculative at this point, but the signature is interesting nonetheless. 


Wednesday, March 18, 2015

MGAUS NCAR March 18 Radiosonde Launches

20150318 140000

 Balloon popped at 62.1 mb. New record! Little to no wind at the surface with nimbostratus clouds above. Strong temperature inversion near the surface; 12 deg warmer 300m above the surface than at the surface. Then the temperature decreased dry adiabatically up until about 600mb. Fairly moist atmosphere up until the tropopause. Wind speeds pick up quite a bit above the surface and are westerly for the most part.

20150318 180000
Overcast. Still little to no surface wind. Temperature inversion just above the surface; smaller than during the 1400 launch. Large, moist layer throughout most of the troposphere. Temperature follows a moist adaiabat from 600mb to 200mb. Strong westerly winds throughout. Note: The launch was initially a little shaky as the software was reporting negative ascent rates to begin with. Aspen software, however, seemed to start recording as soon as the ascent rates stabilized positively.

20150318 220000
LCL around 600mb. Winds become westerly above the surface and speeds pick up as the sonde travels upward. Again, very moist layer from 600mb to the tropopause.

20150319 020000
Surface winds picked up and you could start to smell Greeley (meaning rain soon). Similar sounding to 2200UTC. LCL around 600mb. Large moist layer up until about 200mb. Wind speeds aloft were quite strong and westerly.


NOAA 200S lidar schedule

The two NOAA 200S lidars are now set in a dual Doppler stare.  Each stare is 30 min long.  The lidars are running in 25 range-gate and 0.5 sec accumulation mode.  This will be monitored and we may step back to 50m gates if aerosol conditions are not suitable.  The schedule of the scans is as follows:

Sonic block:
00:00:00 - 50m Sonic stare
00:30:00 - 100m Sonic stare
01:00:00 - 150 m Sonic stare

Super site block:
01:31:00 - 40m Super site stare
02:01:00 - 50m Super site stare
02:31:00 - 60m Super site stare
03:01:00 - 80m Super site stare
03:31:00 - 100m Super site stare
04:01:00 - 120m Super site stare
04:31:00 - 140m Super site stare

Next sonic block - 05:02:00
Super site block - 06:33:00

sonic block - 10:04:00
super site block - 11:35:00

sonic block - 15:06:00
super site block - 16:37:00

sonic block - 20:08:00
super site block - 21:39:00

This data will be used to calibrate the time synchronization between the lidars.

2015 03 18 0200Z Radiosonde Launch Report

The sky was mostly clear. The wind was very mild (less than 5 mph) at the surface. The radiosonde was launched at 02.00Z. The ascent rate was about 6.5 m/s. The boundary layer extended to around 740 mb. The atmosphere was quite stable overall. The air was near saturation at around 730 mb and 410 mb. Winds below 600 mb were mild (below 10 m/s) and the directions varied quite a bit. Strong westerlies at more than 30 kts was observed above 600 mb. The jet stream was recorded around 360 mb at 60 kts. Note that in raw data the sonde started to fall (possibly due to balloon popped) at around 175 mb before I terminated the observation. The ascent was very fast as the whole sounding only took 30 minutes. 


Written by Joseph Lee, 18 March 2015

2015 03 17 2200Z Radiosonde Launch Report

It was partly cloudy with patches of low level stratus. The wind was mild (around 5 mph) at the surface. The weather was fair in general. The radiosonde was launched at 22.00Z. The ascent rate was around 5 m/s. The boundary layer extended to around 780 mb only, then the atmosphere turned from neutral to stable. The atmosphere was quite stable overall. Winds below 600 mb were mild (from 2 to 12 m/s) and the directions varied quite a bit. Strong westerlies at more than 30 kts was observed above 600 mb. Note that in raw data the sonde started to fall (possibly due to balloon popped) at around 100 mb before I terminated the observation.  


Written by Joseph Lee, 18 March 2015